Baltic Dry Index: 5 Powerful Lessons For Investors
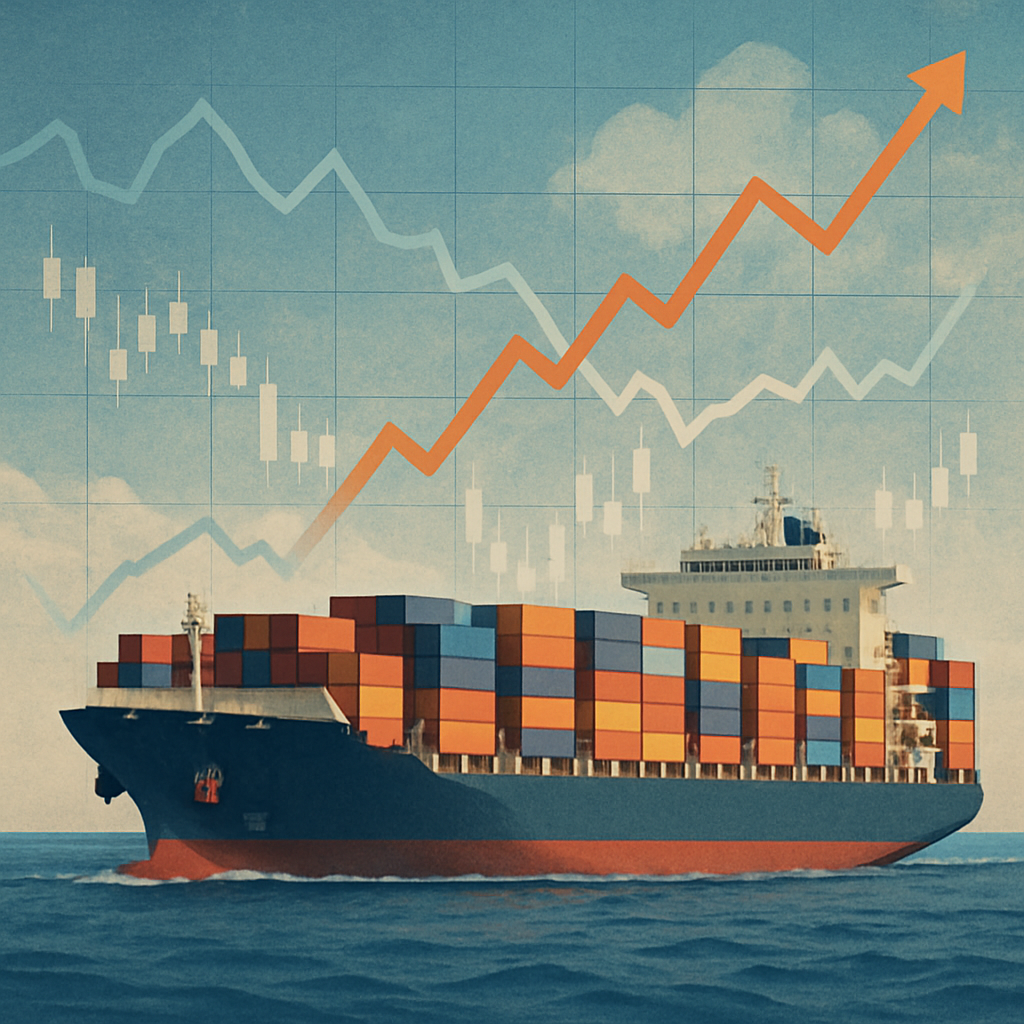
When it comes to understanding the direction of the global economy, few indicators are as quietly powerful as the Baltic Dry Index. Often overlooked by everyday investors, this shipping-based index offers real-time insight into global trade activity—well before headlines catch up. In a world where timing is everything, learning how to read the Baltic Dry Index can give you a serious edge.
In this blog, I’ll break down what it is, what it’s currently telling us, and five powerful lessons investors can learn from tracking it closely.
Key Takeaways – Baltic Dry Index
- The Baltic Dry Index is a reliable leading economic indicator.
- It tracks global demand for shipping key raw materials.
- Sharp changes in the index often precede market shifts.
- Understanding BDI trends can help investors time their strategies.
- AI tools and trend analysis make interpreting BDI easier than ever.
Table of Contents
What Is the Baltic Dry Index?
The Baltic Dry Index (BDI) is a key economic indicator that tracks the cost of shipping raw materials across the world’s oceans. Managed by the Baltic Exchange in London, it provides insight into the demand for commodities like coal, iron ore, and grain by measuring how much it costs to transport these goods by sea.
The BDI is based on several shipping routes and vessel sizes and updates daily, offering a real-time glimpse into the health of global trade.
Why Investors Should Care About the BDI
What makes the Baltic Dry Index powerful is that it reflects real economic activity. Unlike stock prices, which can be influenced by speculation, the BDI is rooted in actual supply and demand.
When demand for shipping raw materials rises, it suggests that manufacturers are ramping up production. When it falls, it may signal a slowdown in industrial activity and economic contraction.
Smart investors use this as a leading indicator—an early warning system that can offer clues about upcoming market conditions.
How to Read the Baltic Dry Index
Understanding the BDI involves more than just looking at whether it’s going up or down. Here’s what to watch for:
- Rising BDI: Indicates increased demand for materials → positive economic outlook.
- Falling BDI: Suggests reduced demand → economic slowdown or oversupply.
- Volatility: May point to instability in global trade or supply chain disruptions.
It’s also important to compare short-term movements with long-term trends to avoid being misled by temporary fluctuations.
2025 Trends: What the Baltic Dry Index Is Telling Us Now
So far in 2025, the BDI has shown noticeable fluctuations. Early in the year, the index surged due to post-holiday shipping congestion and increased demand from Asian manufacturers. However, geopolitical tensions and new tariffs have since disrupted global supply chains.
Recent BDI movements have indicated a slowdown in demand for raw materials, which could be a signal that global economic growth is cooling. Investors should be cautious, especially in sectors like industrials and logistics.
This kind of insight is why I track the BDI regularly. It helps me anticipate broader shifts before they hit mainstream headlines.
5 Powerful Lessons Investors Can Learn from the BDI
1. Follow the Freight, Not the Hype
Market headlines are often reactive. The BDI tells the story before the headlines catch up. When you see a consistent uptick in the index, it usually means global production is rising.
2. BDI Peaks Often Signal Market Tops
In many past cycles, a high BDI has preceded market corrections. Why? Because shipping costs eventually eat into company margins, and the demand surge cools down.
3. Low BDI = Opportunity for Long-Term Entry
When the index drops, fear sets in—but for the long-term investor, that often marks the beginning of a value opportunity. The key is recognizing whether the drop is structural or temporary.
4. BDI Moves Are Global—Not Local
While local economic indicators are useful, the BDI gives you a global picture. It helps you anticipate international shifts that might affect your portfolio or business.
5. AI Can Help You Track and Act Faster
I now use AI-driven tools to track BDI trends, spot anomalies, and time strategic decisions. It’s like having a personal economic analyst in your pocket.
Tools to Track the Baltic Dry Index
Here are a few free and paid resources you can use to monitor the index:
- TradingEconomics.com
- Investing.com – BDI Page
- Yahoo Finance – BDI Tracker
- Freightos Global Shipping Index
Inside the Zero to Millionaire Membership, I also provide custom updates and trend alerts so clients can act ahead of major shifts.
The Baltic Dry Index
The Baltic Dry Index may not be a term you hear on the evening news, but for savvy investors, it’s one of the most underrated tools available.
By tracking real-world demand for global trade and production, the BDI offers valuable early signals that can shape your strategy long before the market reacts. Learn to read the signs, stay patient, and act strategically.
Further Reading
Economy Hub
Visit Karen Newton International Economy Hub and learn more about what impacts the economy
FAQ – Baltic Dry Index
What is Considered a High or Low Baltic Dry Index?
There’s no universal threshold, but historically, levels below 1,000 suggest weak demand, while levels above 2,000 indicate strong shipping demand.
How Often is the BDI Updated?
Daily, by the Baltic Exchange
Can Beginners Use the Baltic Dry Index to Invest?
Yes. It’s actually a great early-warning tool even for beginners, especially when paired with educational content or AI tools that simplify the data.
Is the BDI Influenced by Speculation?
No. That’s one of its strengths. It reflects real shipping demand, not market hype.
Which Sectors are Most Impacted by BDI Changes?
Commodities, manufacturing, shipping and industrial stocks are directly affected, but the ripple effect touches almost all sectors
Karen Newton International Ecosystem
Glossary
A definition of words and phrases used on this page is available in Karen Newton International Glossary

Karen Newton is a Business and Wealth Strategist, 3x International Bestselling Author, and founder of Karen Newton International. She combines practical experience with AI-Powered Entrepreneurship to help smart entrepreneurs build online income, invest strategically, and create long-term wealth through business growth, investments and joint ventures.
